With so many plug fan models to choose from, how do you know which one to select for your specific project?
What parameters should you be looking for? Blade diameter, motor horsepower, max RPM, redundancy, etc.? This page is to help those who don’t deal with fans/fan systems often or people who need a refresher on fan performance. After reading this, you can spot a lousy fan selection from a mile away.
Our entire catalog comprises ECM (Electronically Commutated Motor) plug fans. We chose these fans because of their incredible efficiency, ease of installation, and lack of perpetual maintenance. By looking deeper at the performance profile of each fan, we can see that each one differs slightly, which allows us to cover a comprehensive range of operating points by having multiple plug fans work together in the same airstream.
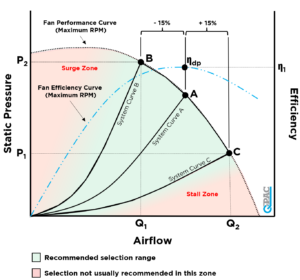
Here is an example of a fan performance curve along with its efficiency curve.
A fan performance curve is a visual representation of the performance of a specific fan. At a fixed RPM, the curve will tell you how much airflow to expect at a given static pressure. Static pressure measures how much resistance to airflow you have in your system. If there is lots of ductwork or equipment to draw air through, that is more resistance to airflow in the system. Following the curve shows that as your static increases, your airflow decreases. At first glance, it may seem overwhelming, so let me break it down below.
- On the X-Axis, you have Airflow. On the Y-Axis, we have Static Pressure. The graph above shows only one RPM band labeled Fan Performance Curve (Maximum RPM). Sometimes, fan performance curves will have multiple RPM bands presented. The fan performance cannot exceed the bounds of the max RPM band.
- Notice the blue Efficiency curve. This curve represents the wire-to-air efficiency of the fan, a measure of how well the fan converts electrical energy into airflow. It is recommended that your duty point be as close to the peak of the efficiency curve as possible; this is why Duty Point A is the best. When comparing the Fan Performance Curve to the Efficiency Curve, you can see Duty Point A falls directly at the peak of the efficiency curve.
- The efficiency curve alone will not tell you the complete performance profile of the fan, as it only tells you how well the fan uses the energy provided. Make sure you have both the efficiency and fan performance curves when deciding what fan to select.
- To comply with relevant regulations and ensure maximum energy savings, the efficiency of the fan system should be a critical data point when deciding between options. Notice how Duty Point A falls directly underneath the peak efficiency location on the Blue efficiency curve marked as ηdp. Air movement standards recommend a specific range of selection from peak efficiency depending on fan type. In the graph above, it is marked as +/- 15%.
- Duty Points B & C fall on the boundaries of the recommended selection range, which was determined by finding the peak efficiency point and moving +/- 15%. With these boundaries in mind, a selection at this maximum RPM would have an Airflow range of Q1 – Q2 and a Static Pressure range of P1 to P2, where Q1 and P1 represent the recommended minimum values, and Q2 and P2 are the recommended maximum values.
- The zones in Red are not recommended because of two key factors.
- The first is the inefficient operation. Many energy standards would prohibit these operating zones due to the decrease in efficiency. With FEG & FEI requirements, these selections would not be allowed in many places.
- The second reason is due to the aerodynamics of the impeller. Operating in the Surge Zone can cause substantial vibration, leading to physical damage and shortening system life. Operating in the Stall Zone may cause a higher chance of noisy operation and vibration or rumbling in some cases.
The sample curve above is only an example,
so the shape of the curves or the ideal operating point of your system may not match directly with what you see there. Some fan types may be able to operate closer to the surge or stall zones than other fan types. If you need more clarification, consult the fan manufacturer for the safe selection ranges.
The next step is calculating several key values to help you decide what fan system to use. Thankfully, our selection software does the number crunching for you after the desired duty point is entered. The airflow, static pressure, installation dimensions, and voltage are all you need to start selecting in QUIPS, Q-PAC’s selection software. QUIPS displays all the fan array variations meeting the entered requirements and shows an array performance curve. Whether you value the fan array’s physical footprint, operating efficiency, price, redundancy, or power consumption, you can quickly sort the options to view the best product for your application.
____________________________________________________________________________________


